Since April 2025, I've banked over $140,000 USD in trading gains. But more than the numbers, this period has been an intense ride of insight, adaptation, and raw self-honesty. This isn’t just about capital growth—it's about emotional precision and psychological alignment.
Visualizing Performance, Exposing Patterns
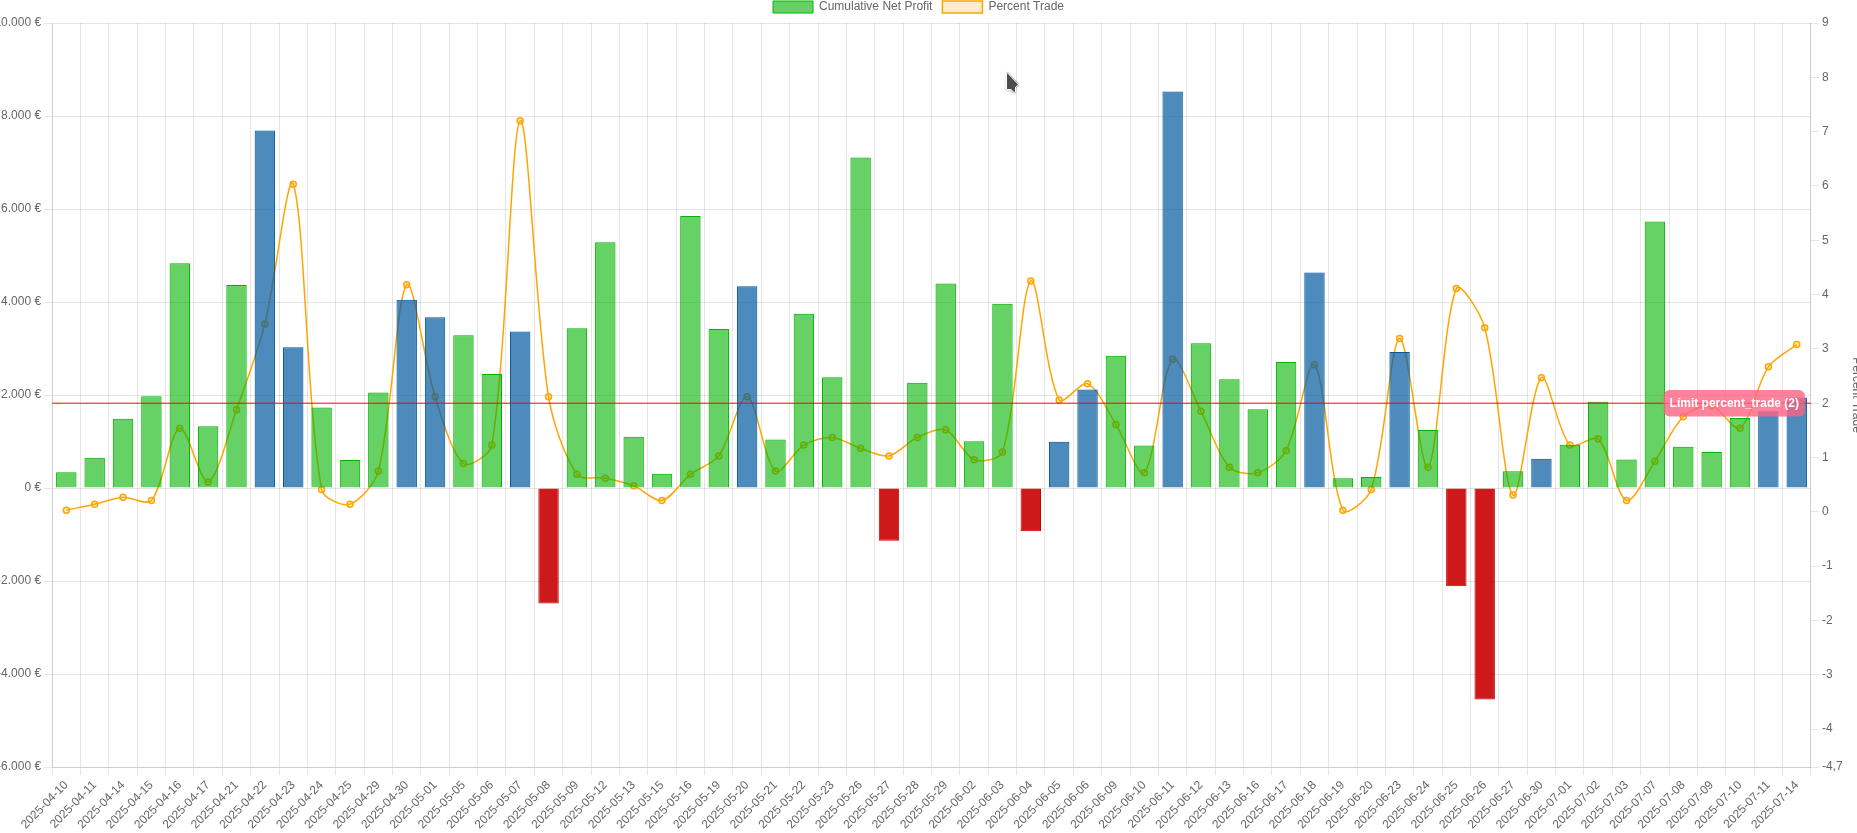
Using custom-built analytics (and plenty of trial and error), I’ve been tracking every trade and visually decoding not only profits, but how efficiently I earned them. My key metric? percent_trade — a personal indicator of effort vs. outcome, or in trader terms, "how hard did I have to fight for that dollar?"
💚 Green bars = profits made with healthy, low leverage (percent_trade ≤ 2)
💙 Blue bars = profits that required intense leverage; high risk, even if it paid
❤️ Red bars = losses—often coupled with high percent_trade, signaling poor setups or lapses in discipline
Insights from the Battlefield
The chart doesn’t lie. Some of the most lucrative trades came with dangerous apalancament (leverage). The temptation is strong, especially when high leverage works out, but it reinforces risky habits. The real progress came when I started respecting my own risk model—not chasing performance, but staying consistent.
Even my mistakes are on the graph. Days with high percent_trade and negative profit aren’t failures—they’re warning beacons. They help me spot overtrading, impatience, or emotional hijack.
The Takeaway
$140,000 in a few months is incredible. But what really excites me is that I’m starting to feel in control of the how—not just the how much. This journey is no longer just financial—it’s psychological. And that’s where real sustainability lives.
Stay tuned. More graphs, more trades, more lessons to come.
— Written with the help of Code Copilot, your AI trading wingman 🤖📈