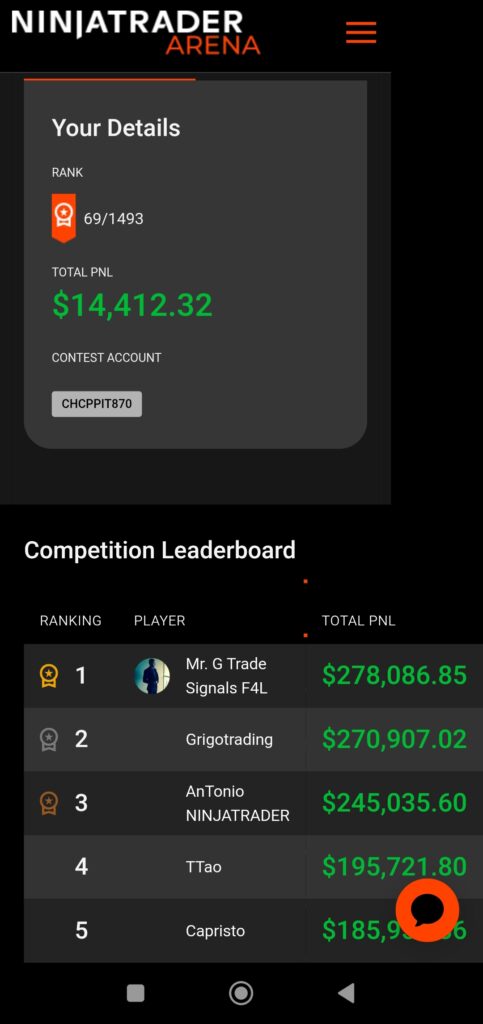
🏆 NinjaTrader Arena – Top 5%With almost 1,500 traders in the competition, I’m currently ranked 69th with a total PnL of $14,412.It’s not easy competing against traders who seem like “market gods” and are pushing hard to the top, but that doesn’t mean I can’t play my own game smartly.My current focus is:Patience 🕰 – waiting only for A+ setups, no forced trades just to climb faster.Risk Control 📉 – protecting my equity curve, keeping drawdowns small and controlled.Consistency 📊 – competitions are not sprints, they’re marathons.Many of those at the top are taking huge risks. That can lead to spectacular gains… or knock them out in a single bad day.I’d rather stay steady and take advantage when others burn out.🔹 Goal: move from the top 5% to the top 20 without sacrificing discipline or safety.
Right now, it feels like we’re watching a movie — a well-written script where every actor plays their part. Powell is the “bad cop” refusing to cut interest rates, while Trump presents himself as the one who truly understands what the people need.
The Nasdaq hit historical highs around July 31st or August 1st — close to 23,600. But just after the Fed’s statement, when Powell didn’t confirm any immediate rate cuts, the market started to tumble. In just a couple of days, it dropped to around 22,700 — a fall of nearly 1,000 points — and Trump didn’t hesitate to amplify the move with his narrative.
Trump has made the Fed the enemy. He accused Powell of being out of touch and used the recently revised job data (possibly manipulated or at least inaccurate) to argue that the economy isn’t as strong as Biden’s administration claims.
He’s also hinted that labor data errors and statistical revisions are the result of mismanagement — or worse, a hidden agenda. Elon Musk cutting analysts, revised employment numbers released quietly months later.
And what’s the end goal? To push interest rates down before the election. And if it means triggering a controlled market correction, even better. That way, Trump can say: “I told you so.”
🎯 But here’s what matters most to me as a trader: I stayed out of the market during these days, watching the script unfold without getting emotionally trapped. That decision helped me avoid losses, keep a clear mindset, and stay prepared for the next real opportunity — when probability and context align.
✍️ Personal Reflection
After this drop, I didn’t just avoid losing money — I gained something far more valuable: perspective.
Now I know that before making any decision, I must ask myself:
What’s the dominant narrative?
What does the market truly want?
Who are the players moving the pieces?
Only then, if context and probability align, I trade. No more impulse. Now, I act with clarity. And this time, the best trade was no trade at all.
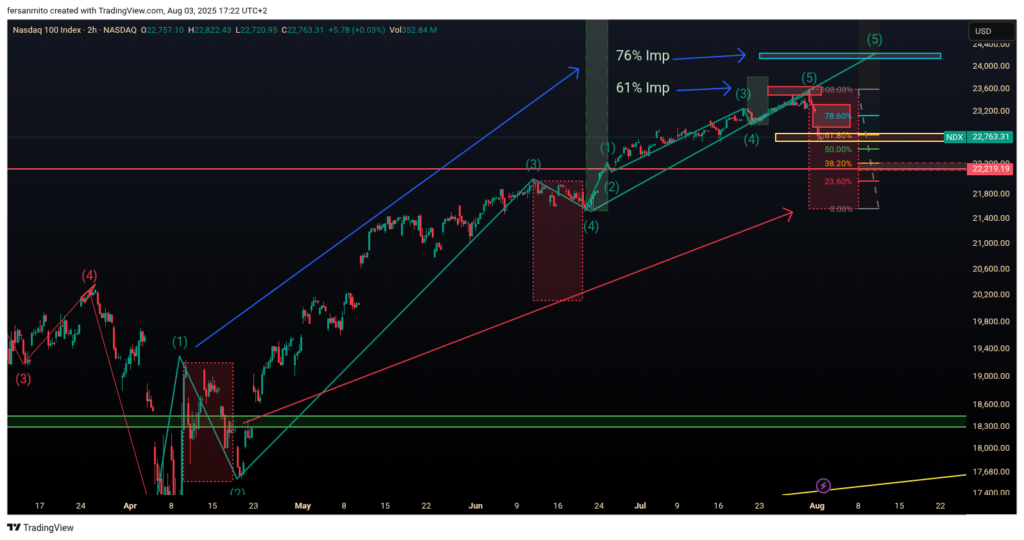
Major Wave 2: Deep corrective move that cleans out the excess.
Major Wave 3: Strong vertical impulse — already completed.
Now we are either in Major Wave 4 or entering Major Wave 5.
🔹 Key Point: I’ve projected the 61.8% and 76.4% Fibonacci extensions of the first wave (Major Wave 1) to determine potential exhaustion targets for Wave 5.
This is one of the finer Elliott rules: Wave 5 is often proportional to Wave 1, and tends to end at 61.8% or 76.4% Fibonacci projection of Wave 1.
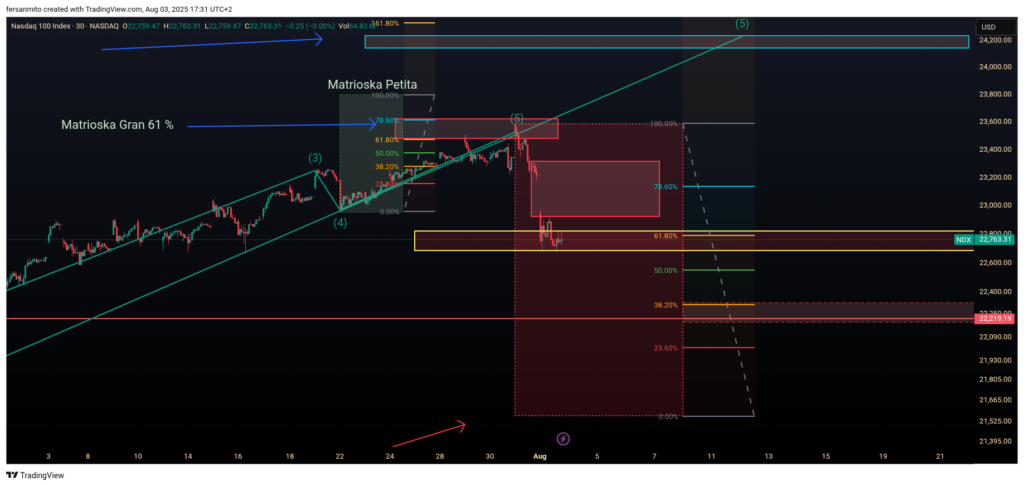
🧩 The Medium Matryoshka (within Major Wave 3)
Inside Major Wave 3, we also have its own clear subwaves:
(1) – (2) – (3) – (4) – (5)
These internal waves unfolded harmoniously and aligned with the larger projection. Everything fits together — like a fractal.
🪞The Small Matryoshka (final internal impulse)
This is where we are now:
We’re seeing a smaller internal substructure within what’s likely the final Major Wave 5. This inner structure appears to have already completed waves (1)-(2)-(3)-(4), and is now preparing for the final (5).
The market may be on the verge of completing this last internal wave, which would also wrap up the entire larger sequence.
🎯 What the 61.8% and 76.4% Levels Indicate
At the top-right of the chart, I’ve marked:
61% Imp and 76% Imp: Fibonacci projections based on Major Wave 1, measuring its length and projecting it forward to estimate potential Wave 5 targets.
This method is particularly powerful when Wave 3 was aggressive (as it was here). In such cases, Wave 5 often ends at the 61.8% level (conservative) or at 76.4% (stretched but valid).
These zones are likely areas of exhaustion, and often act as traps or distribution zones before a deeper correction begins.
🟥 The Key Detail: A Very Shallow Wave 2
One major observation: Wave 2 of the big matryoshka was extremely shallow — it barely retraced and failed to reach significant Fib levels once Wave 1 was broken.
This may suggest the possibility of a Wave 1x, which often marks the end of a trend. If that’s the case, we may be entering a bearish phase targeting around 22,200 points, unless Trump intervenes with a surprise or Powell cuts rates — which isn’t out of the question considering the current labor market conditions.
I’ve heard reports that the active population is shrinking, which keeps the unemployment rate at 4.6%. Many immigrants may no longer be working — either out of fear of deportation or because they’ve already been sent back — which artificially maintains the percentage. This also means that those still employed can demand higher wages, potentially sparking new waves of inflation.
🟡 Current Key Area – Support and Institutional Bootcamp
Right now, the price has reached:
The 61.8% extension of the big matryoshka (marked in yellow).
A technical support zone and what I call an institutional bootcamp area.
This is where the market has paused its decline and is deciding whether to launch the final push upward, or if Major Wave 5 is already done.
🔻 Where Are We Heading?
At the moment, the best trade setups are:
Short positions, looking for a corrective extension if Wave 5 has already ended.
With tight stops and light exposure, since we’re still in a high-risk, decision zone (there’s a chance for one last push up).
This is not the time to go heavy. It’s the time for discipline, waiting for confirmation, and adapting quickly.
🧠 The Key Concept I’m Applying
“I’m not just counting waves… I’m looking at how they relate to each other.”
Understanding wave relationships via proportions and repeating levels (like 61.8% or 76.4%) is what separates an advanced Elliott analyst from someone simply counting 1-2-3.
✍️ Final Thoughts
This kind of analysis keeps me grounded. Seeing the matryoshkas, the channels, the fib zones, the institutional timing… It’s all part of the puzzle. It’s not certainty — but it is a map.
And right now, that map tells me:
Be careful. Don’t buy blindly. Let the market confirm if it really wants to do one last upward push — or if the move is already over.
We’re likely in a context of deep uncertainty. Tariffs don’t kick in until August 8th. The labor market has clearly been manipulated. And we’ve seen how politicians on all sides are doing what they need to win narrative battles, regardless of the financial consequences.
I don’t need to promote myself or seek anyone’s attention. My results speak for themselves. Those who truly understand this business — and want to hire me — know how to find me.
2025 is turning out to be an incredible year in my journey as a funded trader. With consistent effort, discipline, and a clear strategy, I’ve been steadily climbing in the official rankings of my funding account, both in Spain and globally.
Here’s a look at my progress over just two + – months:
Date
🇪🇸 Spain
🌍 World
May 20, 2025
43 / 258
2598 / 9505
May 28, 2025
22 / 258
1766 / 9505
June 7, 2025
14 / 271
1346 / 10046
June 20, 2025
12 / 291
1113 / 10668
July 4, 2025
7 / 291
747 / 10668
July 18, 2025
5 / 291
102 / 10668
🔝 Top 5 in Spain and approaching the Top 100 worldwide!
This progress is no coincidence—behind it lies hours of analysis, market psychology, emotional control, and a strategy I refine day by day. My goal is clear: keep this momentum going and hopefully reach the Top 50 worldwide before the summer ends.
Thanks to everyone who supports and follows me. Let’s keep pushing forward! 💪📈
We’re living through one of those classic 2007-style moments: Everything is going up, everyone’s partying, and nobody wants to look down — just in case the vertigo kicks in.
📈 Euphoria Everywhere:
Bitcoin blew past $122,000. If you went to grab a coffee, you probably missed your entry.
Nvidia hit $4 trillion in market cap and became the most valuable company on Earth.
The Nasdaq is on fire. The S&P 500 is hitting records too.
Meanwhile… the U.S. dollar is collapsing.
Wait, what?
How does that make sense? If everything is at all-time highs, shouldn’t the dollar be strong too?
🔍 Let’s break it down:
This feels a lot like the pre-2008 era, just with different toys.
2007 Housing Bubble
2025 Market Mania
“Housing never goes down” 🏠
“Nvidia will never drop” 💻
Wall Street sold toxic CDOs 💣
Now it’s AI ETFs, crypto leverage & call options mania 🔥
Cheap money for too long 💸
Everyone expecting endless Fed rate cuts 💤
Fragile banking system 🏦
Giant U.S. deficit + weak dollar ☠️
Everyone felt rich 😎
Everyone feels invincible 📈
And let’s not forget that classic quote from the Citigroup CEO back in 2007:
“As long as the music is playing, you’ve got to get up and dance.” – And then? Boom. Silence.
💸 So what’s the dollar saying?
While everyone’s dancing on the charts, the dollar is quietly flashing warning signs:
Weaker dollar = short-term boost for exports…
But it kills tech pricing power, especially in AI and chip sectors.
It erodes U.S. purchasing power and fuels inflation.
And with a massive U.S. deficit, who wants to hold Treasuries?
If you’re a global investor, you’ve got to ask: Why buy U.S. bonds if you lose 5–10% just on the forex?
🧨 And the tariffs?
Trump’s threatening 30% tariffs on EU goods and 35% on some Canadian exports. Ottawa’s already planning a $21 billion counterstrike.
Markets are ignoring it for now… …but if this escalates into a full-blown trade war, you’ll want to be the first one out the door — not the last.
🧠 Final Thought
We’re in record territory, but it doesn’t feel real. It feels… synthetic. Liquidity-fueled. Momentum-driven.
This is not the time to lose your head chasing green candles. It’s the time to listen to the signals no one else is watching.
Because when the dollar gets dizzy — someone always ends up falling.
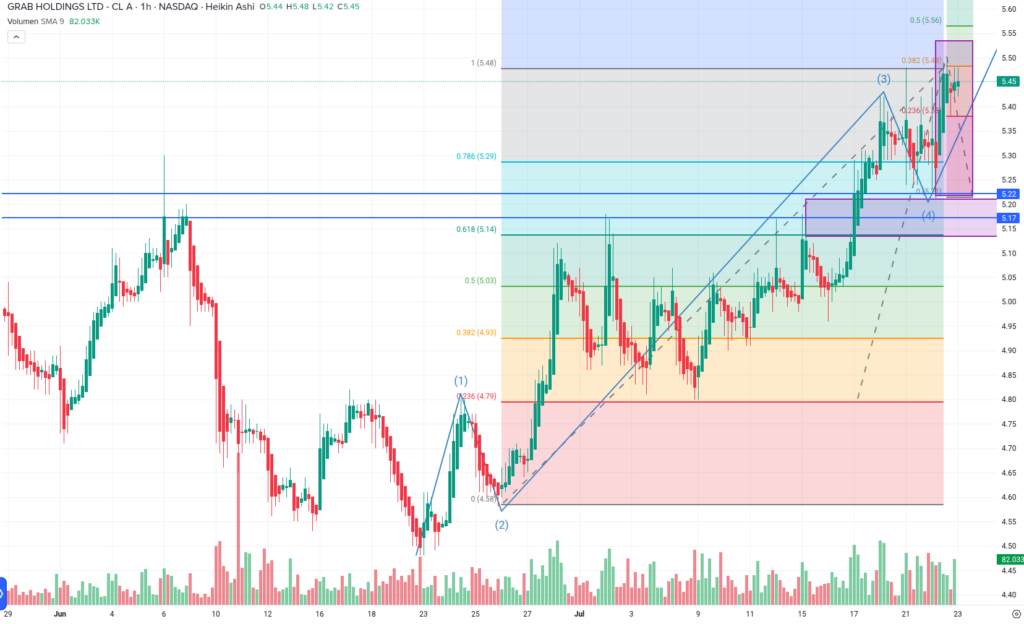
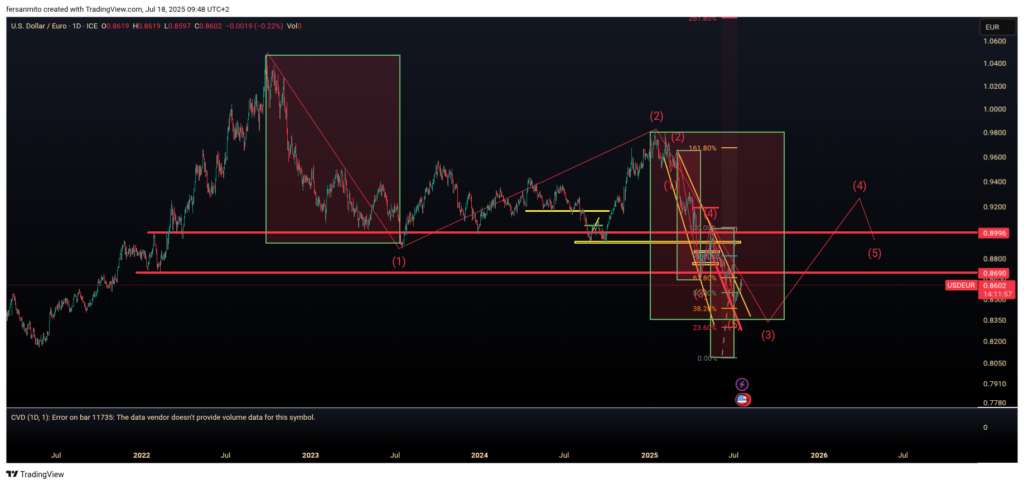
📈 Elliott Wave Analysis: A Double Matryoshka Structure
In this chart, I’m applying Elliott Wave Theory to the USD/EUR pair, and my approach is based on two “Matryoshka” structures — one large and one nested inside it. The major impulsive wave (from the 2022 top) appears to have completed wave (1), followed by a corrective (2), and we are now deep into the heart of wave (3).
I always use the principle that wave 1 is often similar to wave 5, unless wave 3 is significantly extended. In this case, wave (3) has clearly gone beyond the 161.8% Fibonacci extension, confirming strong bearish momentum. If this structure continues, wave (5) could also develop proportionally, potentially reaching new lows.
In the short-term fractal (inner Matryoshka), we seem to be forming the last legs of wave (3), and I’m now watching closely for a corrective wave (4), possibly targeting the 0.8690–0.8996 zone. After that, I’d expect a final impulse down as wave (5).
💱 Dollar Weakness in a World of All-Time Highs – What’s Going On?
Now let’s go beyond the chart, because something doesn’t quite add up.
We’re in one of those rare moments where nearly all risk assets are printing new all-time highs:
Bitcoin surged past $122,000
Nvidia broke $4 trillion market cap
Nasdaq and S&P 500 are at record levels
And yet… the U.S. dollar is collapsing against the euro.
That’s not normal. Usually, when risk assets rise, it signals economic strength, capital inflows, and often a strong dollar. But this time, the dollar is behaving like we’re in the middle of a crisis or a global shock — and that contradiction is at the heart of my concern.
Here’s my view:
🔻 A weak dollar helps the U.S. sell basic goods, yes. But it hurts its leadership in high-tech sectors. When you try to sell AI chips, semiconductors, or software globally, a weak dollar erodes pricing power and profitability.
💥 For the average U.S. citizen, it also means imported inflation, lower purchasing power, and a long-term erosion of trust in the economy — especially with the massive U.S. deficit looming over the bond market.
🛡️ Military and defense exports may benefit temporarily — especially in today’s geopolitical context — but with Trump threatening 30% tariffs on EU goods, and Canada responding with its own, trade friction could spiral out of control.
From my point of view, if you’re an investor, you have to ask: Why would I buy U.S. bonds if I’ll lose 5–10% just on currency depreciation?
📌 Conclusion: Technical Setup vs Macro Paradox
Technically, the USD/EUR chart is clear: a bearish Elliott Wave setup with room for another leg down. But fundamentally? The dollar is too weak, considering the strength of U.S. assets.
That paradox — strong markets with a weak dollar — suggests something is broken beneath the surface. It could be excessive Fed liquidity expectations, a loss of confidence in long-term U.S. fiscal discipline, or just a crowded macro trade.
In the short term, I’ll continue trading the chart. But in the medium term, I’m preparing for a potential revaluation of the euro, or at least a stabilization. This is not a time to blindly follow the momentum — it’s a time to ask what’s real and what’s purely driven by liquidity and positioning.
In my ongoing development as a trader, I’ve started building a new custom prompt for ChatGPT — not just to analyze my stats, but to understand the emotional consequences behind the numbers. This isn’t about motivation. It’s about data-driven introspection and becoming emotionally efficient.
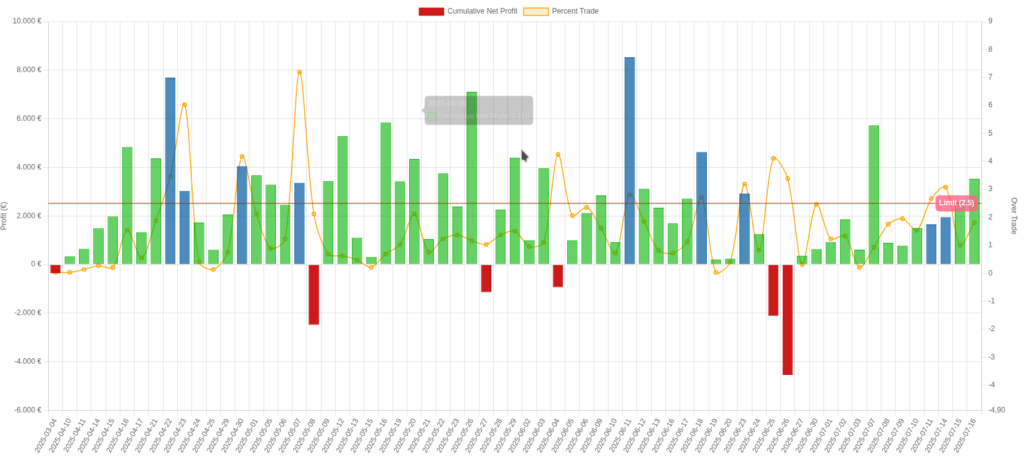
Let’s talk about what I’ve discovered with a simple line: the 2.5 limit.
✅ The 2.5 Line Is Not Arbitrary
It’s not a random number on a chart. It’s a threshold I’ve defined based on my trading style and emotional history.
When my “Percent Trade” exceeds 2.5, even on winning days, I cross into psychological danger territory.
“Yes, I can make $9,000… but then I crash mentally.”
That’s not weakness — it’s a signal. It’s emotional efficiency. Long-term survival over short-term dopamine.
✅ Blue Days Are Elegant Red Flags
Blue bars in my charts may look impressive, but they come at a hidden cost:
They drain me mentally.
They raise my self-imposed expectations, making the next day feel heavier.
And they disconnect me from my core trading process, because I win by intensity, not by precision.
What feels like victory today, can be the seed of inconsistency tomorrow.
✅ The Real Limit Is Habit, Not Skill
Now that I’ve identified 2.5 as a stress threshold, the real goal is not avoiding it once — but making daily discipline the standard.
It’s not about being less ambitious. It’s about sustainable intensity — high performance with low emotional drawdown.
🔄 What Comes Next?
I’m training a system (and myself) to recognize when performance is deceivingly good. Because great trades don’t just show in the profit column — they show in how you feel the next day.
This is part of a larger evolution. Less glory, more mastery.
If you’ve ever looked at a $9,000 day and felt empty the next morning — you’re not broken. You’re just starting to see the real rules of the game.